The graphs show numbers, but also the size of the row of messages. In addition, you can see in a graphical overview the delivered and undelivered messages, the percentage of delivery, average delivery time and ratio of complaints. The average is based on a specific time period.
An important feature on this page is the message search bar. Let's imagine you're looking for information about a specific recipient: you can easily and quickly search for the message here. It is possible to search by email address of the recipient, email address of the sender or a tag that has been given to a message.
On the dashboard, you see the following:
- Datepicker
- Graph with processed, sent and delivered messages per time unit
- The total amount of messages
- The delivery percentage
- Average delivery time
- Complaint rate
- Search input for finding messages
- Total processed messages
- Queued messages
- Report update
Datepicker
You can change the date range for the statistics shown below. Choose a preset time range or enter a custom date range that fits your needs..
Graph with processed, sent and delivered messages per time unit
This graph shows the number of messages that were processed, sent, and delivered.
You can see the number of messages per hour or per day, depending on the selected date range.
It helps you understand how well your messages are doing.
The graph shows:
-
Processed
Yellow bars indicate that messages were filtered. This can happen, for example, if you set up a filter, tried to send messages to email addresses that had already bounced, or used a discard step. These messages were processed but not sent. -
Sent
Red bars mean messages were sent but not delivered. This could mean the messages bounced. - DeliveredLight blue bars show that the messages were delivered successfully.
-
Opened
When you are using the Track Opens Flowstep, dark blue bars show how many messages were opened but not clicked. -
Clicked
When you are using the Track Opens Flowstep, very dark blue bars show how many messages were clicked—this means the contact clicked at least one link in the message. Clicked messages are always opened messages.
The total amount of messages
This shows the number of messages within the selected time frame. It includes sent, filtered and bounced messages.
The delivery percentage
This shows the percentage of messages that were successfully delivered.
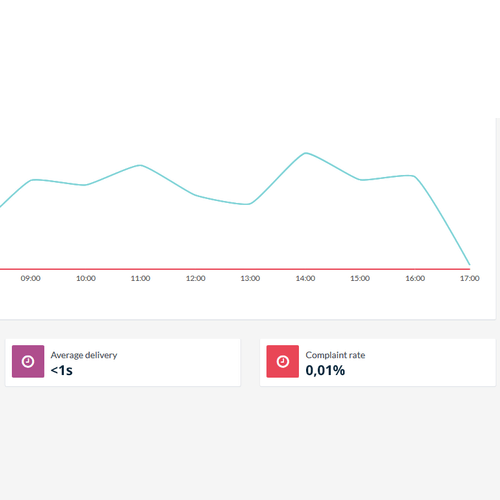
Average delivery time
This is the time it takes for a message to be accepted. If you're unsure why a message isn’t arriving in an inbox, it could be because the delivery time is too high.
Complaint Rate
On average, the spam complaint rate is around 0.01%. If this number is much higher, it may mean your contacts don’t want to receive your emails and/or there is no option for them to unsubscribe. A high complaint rate can hurt your sender reputation, which can lead to longer delivery times and even cause your emails to be marked as spam.
When your emails don't arrive, you know something is wrong. There are then several reasons, such as using the wrong e-mail address or missing dates. Another reason that your e-mail is not arriving is that you ended up in the spam box. For transactional e-mail, this often has to do with a complaint rate that is too high. This rate is an essential indicator of your transactional email flows. Too high a complaint rate negatively affects the delivery of your emails.
Feedback loops and complaints
When your transactional e-mail messages are delivered to specific web-based e-mail clients of Internet Service Providers (ISP) like Outlook, Gmail, or Yahoo, the recipient can indicate that your message is 'unwanted'.
Such a signal is sent back to Spotler SendPro by the relevant ISP through a so-called feedback loop. To prevent a recipient who sends such a signal from being contacted again by e-mail, Spotler SendPro places the e-mail address of this recipient on the filter list with the status complaint.
Given the nature of the e-mail messages you send through the Spotler SendPro platform, you can expect the number of recipients who send such a signal to be negligible. To gain insight into the extent to which this is the case, Spotler SendPro recently started reporting the complaint rate on the dashboard. This ratio is calculated by plotting the number of complaints during a period against the number of sent email messages during that period (by default, the complaint rate is displayed for 'today').
Search input for finding messages
This is helpful if you want to check whether a message was sent to a specific contact or see which messages that contact has received. Simply enter the contact's email address, message ID, Tag or Sender Adress, and a list of messages will appear, ordered by send date.
Total processed messages
The number of messages sent and the percentage of messages that were processed, delivered, opened and clicked.
In this example, 55,214 messages were processed. Out of these, 55,056 messages were sent, and 54,627 of those were successfully delivered. Out of the 54,627, 22,917 were opened and 6,701 clicked as well.
Queued messages
In the lower right graph, you can see how many messages are being processed. When many messages are sent to SendPro at once, the queue will increase. If there are a lot of messages, it might take some time to send all of them. The graph shows the peaks in the queue and how many messages have been processed. If the queue doesn't decrease, there could be a problem.
Report update
The report doesn't always show real-time data . You can check the last update time in the lower left corner.